
Did Fed Rate Hikes Decrease Lending, Spending, and Inflation?
Did Fed Rate Hikes Decrease Lending, Spending, and Inflation?
Reduced lending and borrowing since the hikes pales compared to far larger covid-era balance-sheet changes.

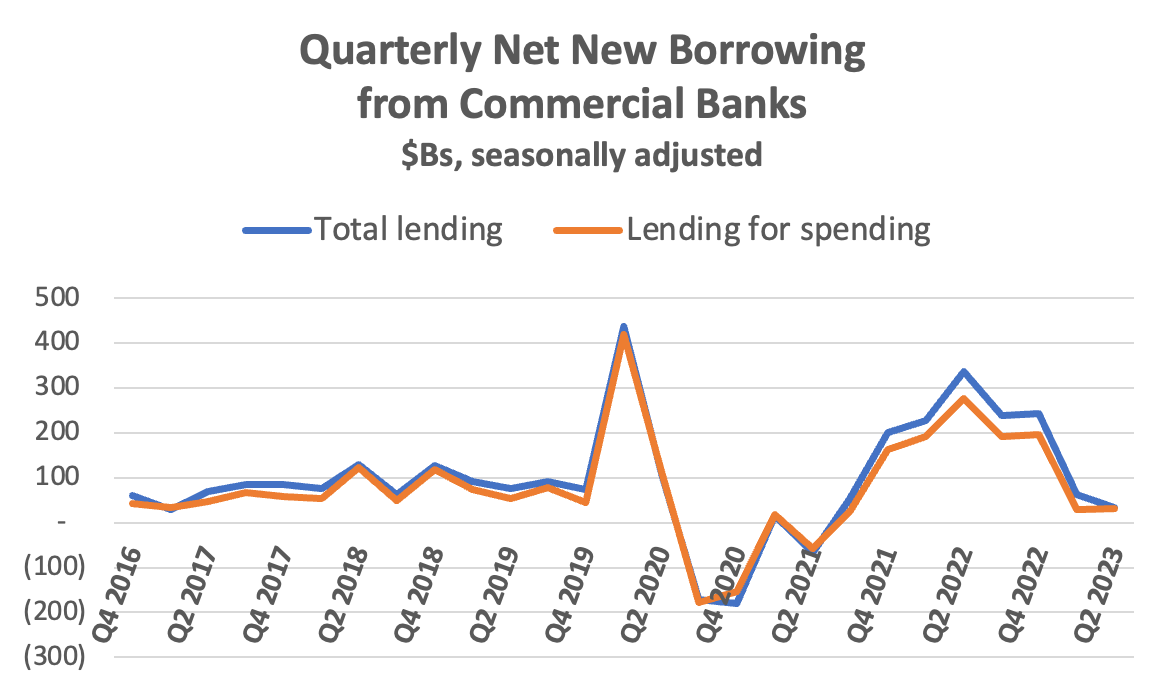
In March 2022 the Fed started hiking rates. Rates for bank borrowing followed suit. How much did those hikes affect borrowing from banks? It looks like quite a lot. Here’s quarterly net new bank lending.1

2023 borrowing (Q1 and Q2) is running $49B per quarter. It’s a big drop from $337B when the Fed started hiking, but it’s basically back in the same ballpark as the $83B pre-covid average (2017–19).
The big anomaly is not current lowish levels of lending/borrowing, it’s the big surge preceding it — mostly driven by now-defunct covid-era federal loan(-guarantee) and student-loan-deferment programs. (Remember we’re looking at net new borrowing here: new borrowing minus loan payoffs. = Change in outstanding loans.) But even during its five-quarter peak (Q4 ’21 through Q4 ’22), that lending was briefly adding less than $1T a year to households’ and firms’ asset balances. Direct transfers from Treasury, by comparison, added $4T or $5T overall.
And that doesn’t even consider unprecedented wealth increases from asset-price runups: in the first seven quarters of Covid (Q2 ’20 through Q4 ’21), household assets increased by $43T.
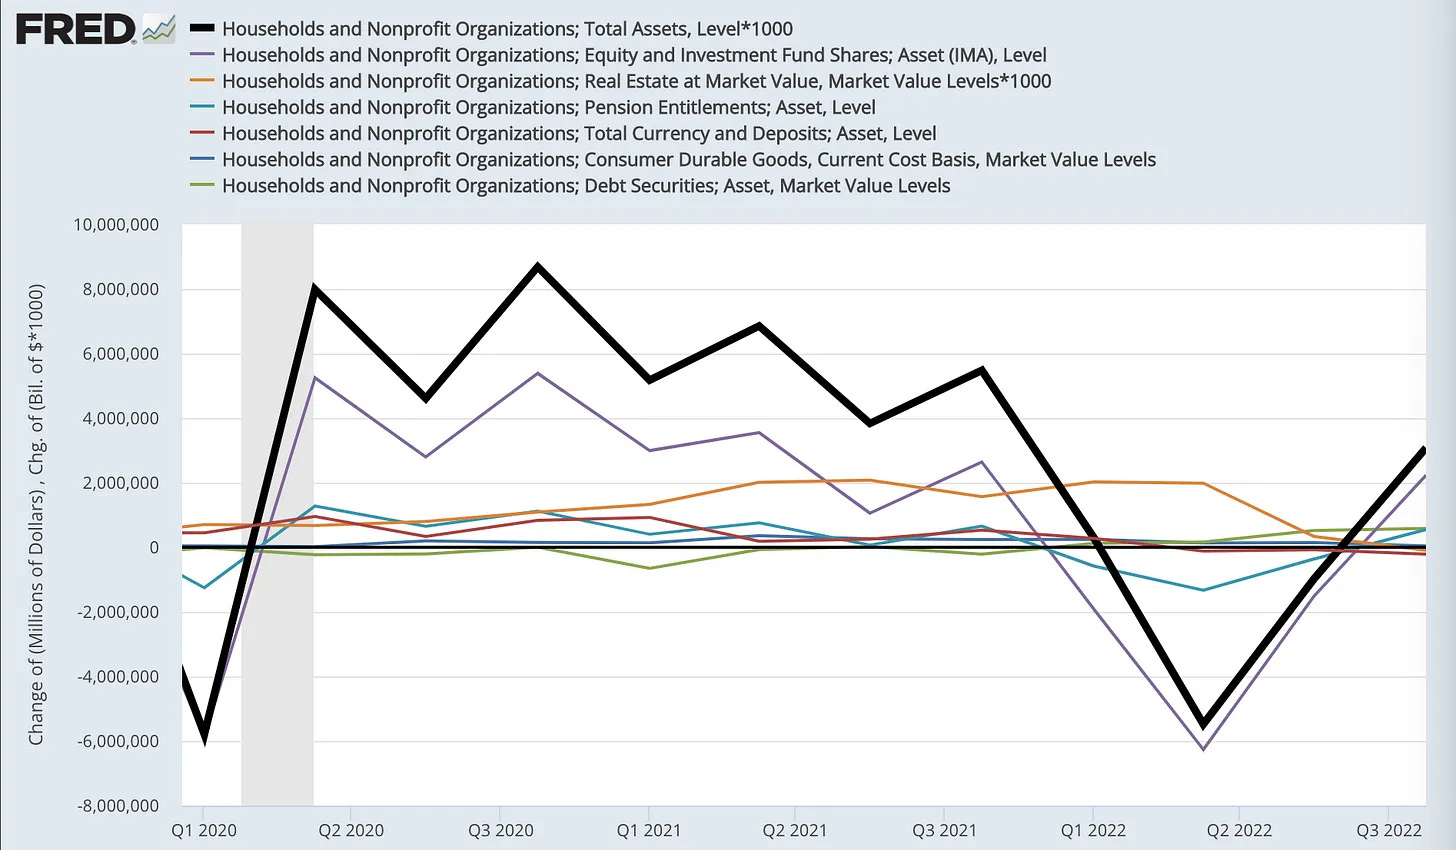
Covid-era bank lending, much less changes in lending, would be almost invisible on this chart.
Also bear in mind: not all lending is lending-for-spending.2 Start with mortgage loans: only about 10% are for spending on purchases of newly-produced homes. The rest are lending for asset swaps: borrow M2 assets and swap them for existing land titles (including improvements). This borrowing-financed real-estate portfolio churn (and associated real-estate price changes) may have indirect, multiple-bank-shot effects on actual spending, but that economic effect is very tricky to estimate.
“Commercial” borrowing by firms is even tricker. A firm can borrow against real-estate, other assets, or just its established “good will,” and spend the assets on newly-produced drill presses, property improvements, etc. They can buy existing real properties, equity shares in other companies, or bonds (all asset swaps). Or they can (and do) just use it to pay dividends or to buy back shares from shareholders.
If we give commercial borrowing 100% credit as lending-for-spending (a questionable choice, but what can you do?), and residential real-estate loans 10% credit, there’s a quite minor reduction from total lending, to lending-for-spending.
But in any case, the rate-driven decline in borrowing, very small-magnitude relative to the huge dollar amounts from fiscal transfers and holding gains on assets, doesn’t seem like it would deliver a very large effect on spending, and hence on inflation.
There are many interacting economic effects at play, but there’s certainly good reason to question how much credit Fed rate hikes should get for the precipitous decline in headline inflation,3 to below Fed target levels, over the last year.

Net new lending = gross new lending minus gross loan payoffs. It equals the assets added to borrowers’ balance sheets from borrowing (along with equal and offsetting liabilities). It might be nice to see those gross figures, but 1. much new lending consists of rollovers/refis, which don’t add assets to the borrowers’ balance sheets. And 2. we don’t have that borrowing/lending transaction data. All we have is the banks’ loan levels (weekly), from the Fed’s Table H.8, “Assets and Liabilities of Commercial Banks” (Table 2 or 3 therein). Net lending (borrowing) in a period is just the change in levels. Here’s a very handy interactive version of Table 2 (seasonally adjusted) on FRED.
Spending, defined: Transferring assets (usually M2 assets) to another unit’s account/balance sheet in exchange for newly-produced goods and services. Purchases of already-existing assets (bonds, equities, titles to land and improvements) are not spending. They’re just asset swaps. They re-adjust the portfolio mix of both the purchaser and the seller, but don’t (directly) cause any production of new assets. In the big picture, these existing-asset purchases are just “portfolio churn.”
“Core” inflation (ex food and energy) and other yet narrower measures ignoring ever-larger portions of the price/inflation data, are only of interest if you’re the Fed presuming to predict future headline inflation, or a Fed tea-leaf watcher trying to predict what the Fed will do based on its predictions. There’s no strong evidence that those bowdlerized measures are superior predictors of future headline inflation, and headline inflation is what matters for the economy at large.