Massive Wealth Accumulation During Covid: The “Excess” ”Savings” “Glut”
Big cash balances only explain 10% of the $43T increase in household assets.
If one huge economic fact stands out as a perplexing during the Covid era (to me at least), unprecedented in its magnitude, it’s the runup in U.S. household wealth over the first two years. What in the hell? Global economic activity tanks, and households get much richer? Here’s quarterly change in household assets through Q4 2022 (just released), with selected big asset classes broken out.1
There was a big dive and recovery before Covid, starting with the December, 2018 equity market drawdown. But just focusing on the Covid era:
After a brief drawdown in Q1 2020, in the first two years of Covid, household assets increased by $43T, 33%. The runup was (as is typical) dominated by equity price-runups/holding gains, plus (smaller and somewhat delayed) price-driven real-estate holding gains.
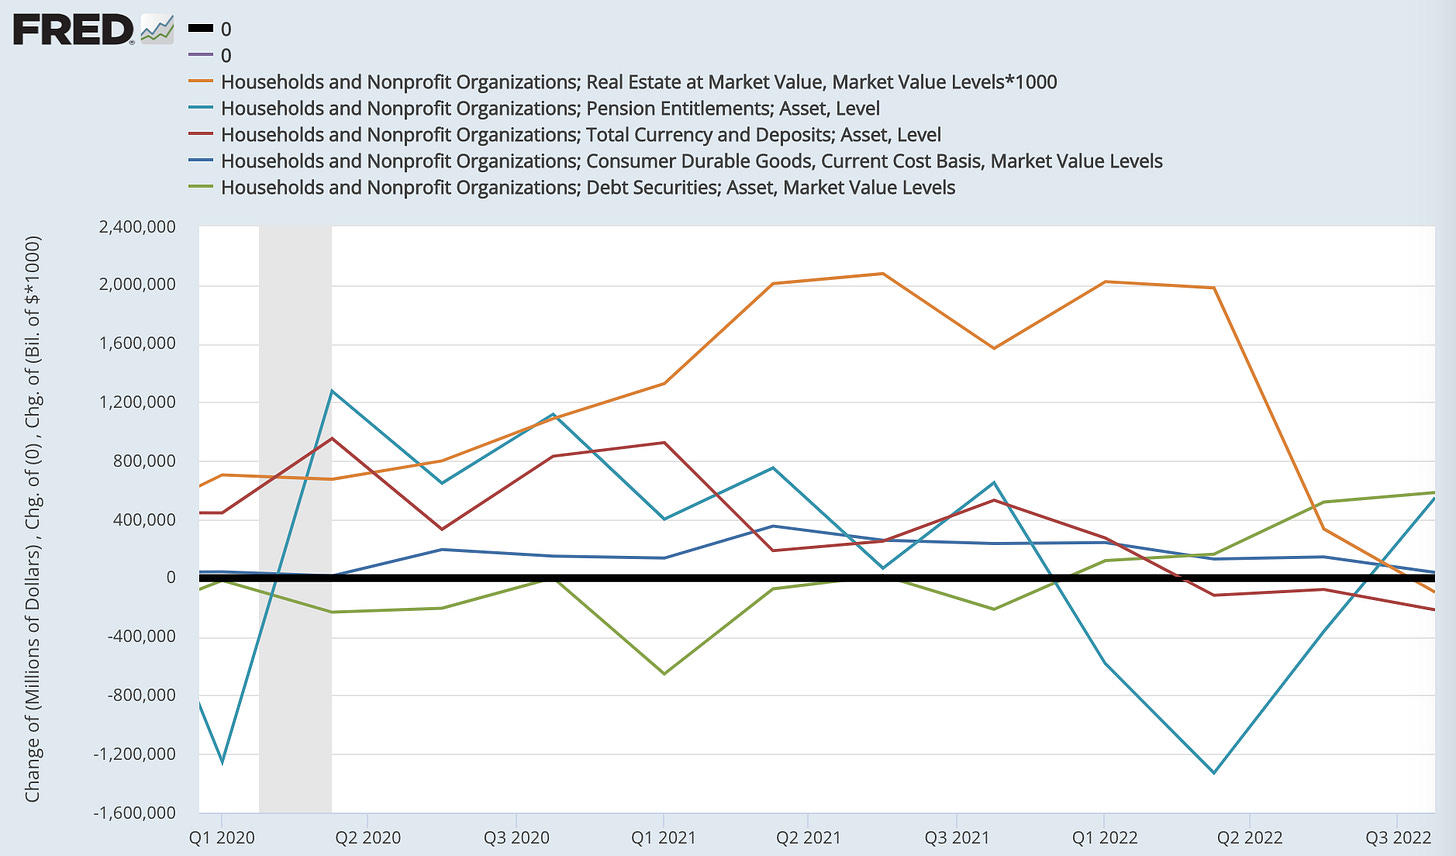
Zeroing out the two big series (equities and total) to zoom in on the others, the second and third largest household asset categories — real estate and pension entitlements — stand out.
Real estate shows an increase as unprecedented as equities, though slightly later, and smaller in dollar magnitude. The big price increases also begin right after the initial shock, and over five quarters starting Q2-2021, real-estate assets were increasing by $1.5T to $2T per quarter. Real estate holdings in Q2 2022 were up $13.6T, 40%, from Q1 2020. (They’re up a little more since then.)
Pension entitlements, a measure that involves complex, technical, and shifting accounting/estimation issues, saw a Covid-era increase of 18% as of Q4 2022, since declined to about 10%.
Zeroing out real estate and pensions to zoom in further, fixed-price “cash” assets (almost all bank- and money-market deposits, M2) show big familiar stimulus-driven surges in 2020-21.
This has been the rather obsessive focus of analysts discussing Covid-era “excess” “savings.” At their Covid-era peak, households’ cash assets were up $4.3T, 33%. But still, that only comprises 10% of the $43T Covid-era household asset runup.
Enquiring minds will surely be curious to know how those asset increases have been distributed across income and wealth percentiles. (You can guess, right?) That’s the subject of a future post, which you can expect as soon as the Distributional Financial Accounts deliver their next release including Q4 2022 results. [Here it is.]
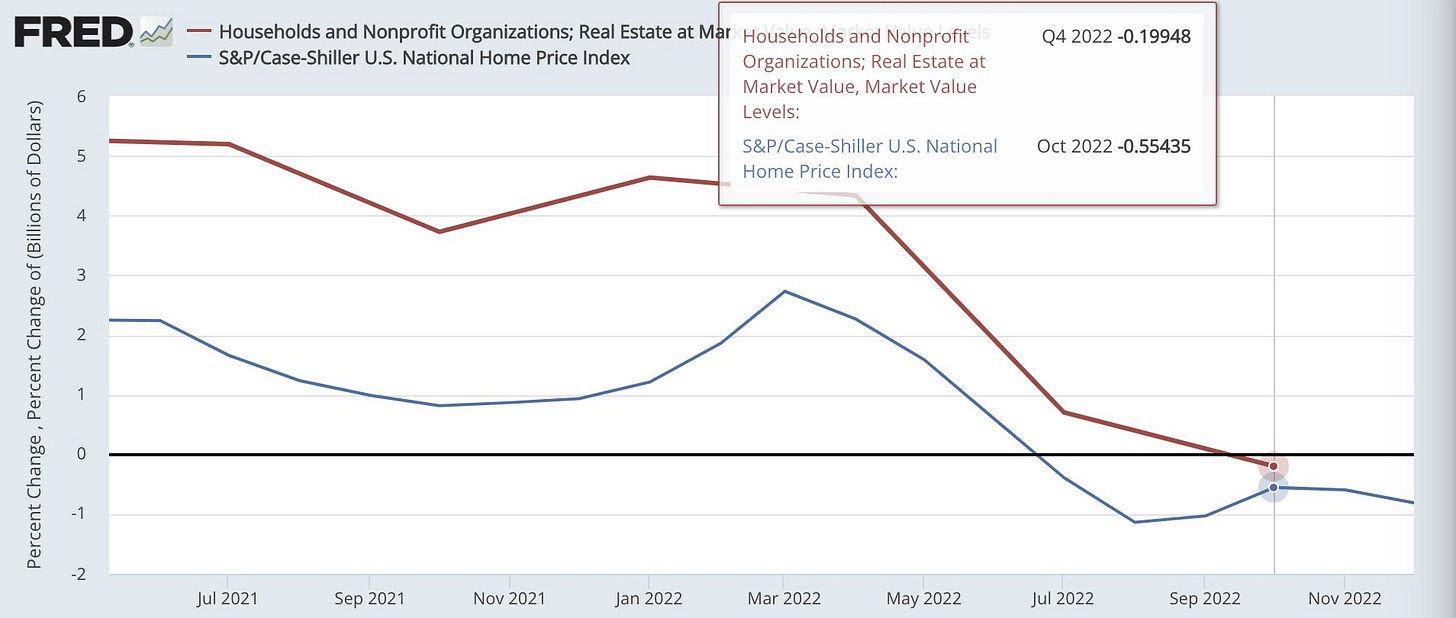
What about now? The new Q4 2022 numbers show some grounds for concern. Households’ real-estate asset holdings declined for the first time since the global financial crisis, while the Case-Shiller national price index has been showing declining prices for six months, starting last July. Shades of 2008?
Big picture, real (inflation adjusted) household assets are down 9.2% year over year. This has been a reliable indicator over six decades that we’re in or about to be in a recession.
Look out below?
FRED graph and data series here. Source: The balance-sheet account in Table S.3, from the Integrated Macroeconomic Accounts.


